Which of these diagrams represents an age structure diagram of more-developed countries? 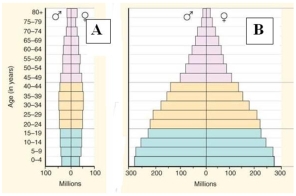
A) Diagram A
B) Diagram B Diagram B is an age structure diagram of less-developed countries, not of more-developed countries.
Correct Answer:
Verified
Q20: Identify the distribution patterns of the desert
Q21: Which of the following lifestyle changes would
Q23: Farmers sprayed leechi trees to suppress populations
Q24: If the members of a population are
Q24: Only the LDCs will be experiencing overpopulation
Q26: Which of the following circumstances would cause
Q27: The sequence of decreased death rate followed
Q29: Which variable is not a density-dependent factor?
A)
Q30: In a population with low death rates,
Q37: Since the population of the LDCs is
Unlock this Answer For Free Now!
View this answer and more for free by performing one of the following actions

Scan the QR code to install the App and get 2 free unlocks

Unlock quizzes for free by uploading documents