Multiple Choice
 Data in this figure suggest
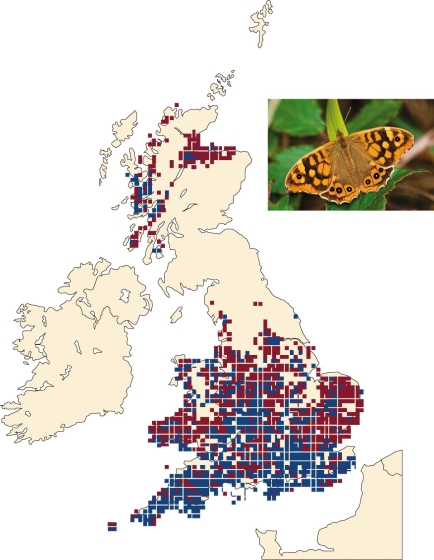
A) butterfly populations are declining.
B) butterfly habitat is degrading over time.
C) butterflies are moving north over time.
D) two species of butterflies are evolving over time.
Correct Answer:
Verified
Related Questions
Q18: Global change predictions are often made using
Q19: Carbon dioxide that dissolves into the ocean
Q20: Differential changes in phenology can result in
Q21: Q22: Warming is predicted to be greatest Q24: During the last 40 years,warmer-water plankton have![]()
A)during winter
Unlock this Answer For Free Now!
View this answer and more for free by performing one of the following actions

Scan the QR code to install the App and get 2 free unlocks

Unlock quizzes for free by uploading documents