Which of the following figures illustrates best the sequence of the free-energy values (shown with the star) for a chemical reaction at equilibrium to the removal of products,followed by the response of the equilibrium to this stress?
A) 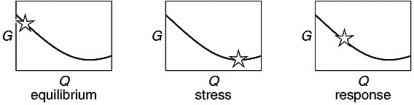
B) 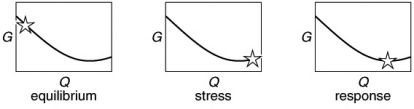
C) 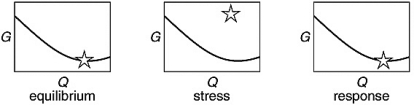
D) 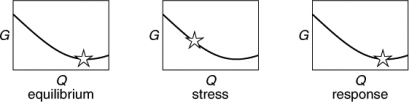
Correct Answer:
Verified
Q53: What is the difference between
Q92: Several groups of general chemistry lab
Q102: For the phase transition,H2O2( 
Q103: As the temperature of a reaction
Q104: A sketch of the free energy
Q105: Using the thermodynamic data below,determine the
Q108: A chemist is planning to study
Q110: What is the value of the
Q111: A student can accept that
Q132: The equilibrium constant for a given reaction
Unlock this Answer For Free Now!
View this answer and more for free by performing one of the following actions

Scan the QR code to install the App and get 2 free unlocks

Unlock quizzes for free by uploading documents