Which of the following graphs shows the correct relationship between pressure and volume for n moles of gas at temperature T ?
A) 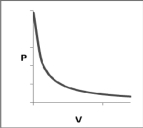
B) 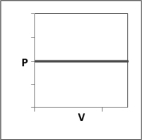
C) 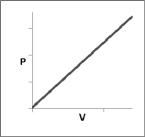
D) 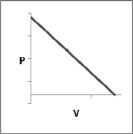
E) 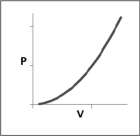
Correct Answer:
Verified
Q5: Which of the following statements regarding how
Q9: Which of the following statements regarding ideal
Q9: Which of the following graphs shows the
Q10: Which of the following statements regarding the
Q10: A gas is contained in the piston
Q15: Which of the following graphs shows the
Q17: To which of the following is the
Q18: Which of the following graphs shows the
Q19: Which of the following gases will escape
Q21: You need to hold the pressure of
Unlock this Answer For Free Now!
View this answer and more for free by performing one of the following actions

Scan the QR code to install the App and get 2 free unlocks

Unlock quizzes for free by uploading documents