Which of the following graphs shows the correct relationship between the temperature and volume of an ideal gas at a given pressure? Note that the origin corresponds to V = 0 and T = 0.
A) 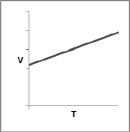
B) 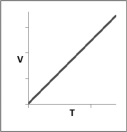
C) 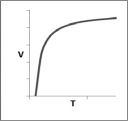
D) 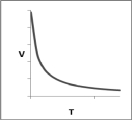
E) 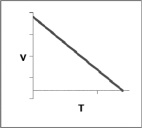
Correct Answer:
Verified
Q5: Which of the following statements regarding how
Q13: Which of the following graphs shows the
Q15: Which of the following graphs shows the
Q17: To which of the following is the
Q19: Which of the following gases will escape
Q19: The pressure of a gas is inversely
Q22: Which one of the following is NOT
Q23: Which one of the following is not
Q39: Which of the following will have the
Q110: The kinetic theory of gases assumes that
Unlock this Answer For Free Now!
View this answer and more for free by performing one of the following actions

Scan the QR code to install the App and get 2 free unlocks

Unlock quizzes for free by uploading documents