The following graph shows the kinetics curves for the reaction of oxygen with hydrogen to form water:  . Which curve is hydrogen?
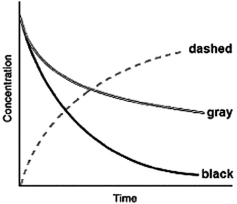
A) the dashed curve
B) the gray curve
C) the black curve
D) either the gray or the black curve
E) Any of these curves could be hydrogen.
Correct Answer:
Verified
Q20: One reaction that occurs in an automobile
Q21: From the following concentration versus time plot
Q22: In the combustion of methane, 
Q23: Which of the following is a possible
Q24: A scientist conducts an experiment to determine
Q26: If the rate of appearance of O2
Q27: If the rate of the reaction:
Q28: Which of the following is not a
Q29: From the following concentration versus time plot
Q30: HI dissociates to form I2 and H2:
Unlock this Answer For Free Now!
View this answer and more for free by performing one of the following actions

Scan the QR code to install the App and get 2 free unlocks

Unlock quizzes for free by uploading documents