Which of the following bar charts shows the correct internal energy changes that occur in a pitcher of iced tea (system) , the refrigerator (surroundings) , and the universe as the iced tea in the refrigerator cools?
A) 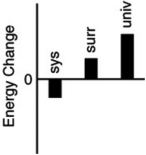
B) 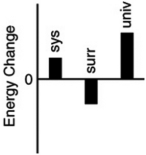
C) 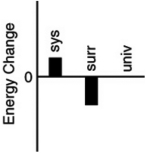
D) 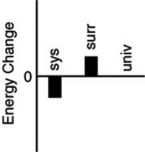
Correct Answer:
Verified
Q18: A diver jumps off a diving board.
Q19: Which statement A-D about the relationship between
Q20: Assuming that the distances between the two
Q21: Which arrow in the following diagrams represents
Q22: Internal energy is defined as _
A)the total
Q24: What is the change in internal
Q25: Which of the changes A-D will always
Q26: The first law of thermodynamics implies that
Q27: When solid sodium hydroxide (NaOH) pellets are
Q28: Which statement A-D about a system and
Unlock this Answer For Free Now!
View this answer and more for free by performing one of the following actions

Scan the QR code to install the App and get 2 free unlocks

Unlock quizzes for free by uploading documents