Draw a scatter plot for the following data that show the demand for a product (in hundreds) and its price (in dollars) charged in nine different cities. 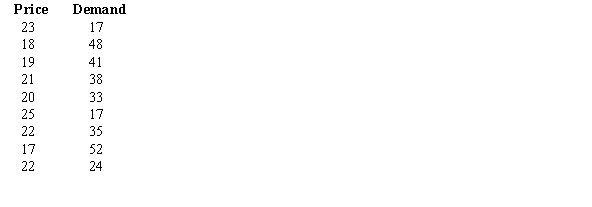
Correct Answer:
Verified
Q9: In a relationship, as one variable increases,
Q11: The rounding rule for the correlation coefficient
Q14: Determine the type of relationship shown in
Q16: Compute the value of the correlation coefficient.
Q17: An experiment is carried out to determine
Q19: A study was conducted to determine if
Q20: A correlation coefficient of 0.961 would mean
Q21: The equation of a regression line is
Q22: Using a regression line of 
Q23: A psychologist wants to determine if there
Unlock this Answer For Free Now!
View this answer and more for free by performing one of the following actions

Scan the QR code to install the App and get 2 free unlocks

Unlock quizzes for free by uploading documents