Exhibit 9.3
The following questions are based on the problem description and spreadsheet below.
A researcher is interested in determining how many calories young men consume. She measured the age of the individuals and recorded how much food they ate each day for a month. The average daily consumption was recorded as the dependent variable. She has developed the following Excel spreadsheet of the results. 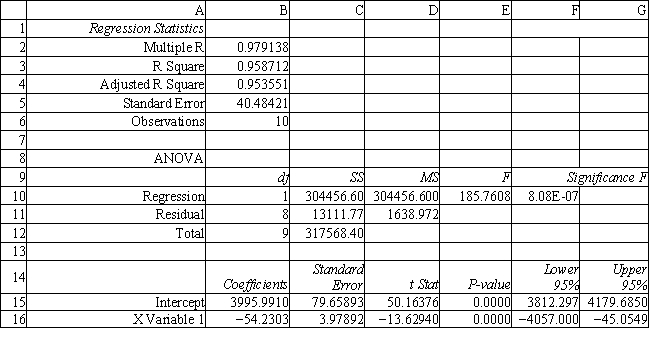
-Refer to Exhibit 9.3. Interpret the meaning of the "Lower 95%" and "Upper 95%" terms in cells F16:G16 of the spreadsheet.
Correct Answer:
Verified
View Answer
Unlock this answer now
Get Access to more Verified Answers free of charge
Q74: Exhibit 9.2
The following questions are based on
Q75: Exhibit 9.2
The following questions are based on
Q76: Exhibit 9.6
The partial regression output below applies
Q77: Regression analysis is a modeling technique
A) that
Q78: Exhibit 9.7
The partial regression output below applies
Q80: Exhibit 9.7
The partial regression output below applies
Q81: Exhibit 9.4
The following questions are based on
Q82: Exhibit 9.1
The following questions are based on
Q83: Exhibit 9.3
The following questions are based on
Q84: Assume you have chosen to use all
Unlock this Answer For Free Now!
View this answer and more for free by performing one of the following actions

Scan the QR code to install the App and get 2 free unlocks

Unlock quizzes for free by uploading documents