Exhibit 9.2
The following questions are based on the problem description and spreadsheet below.
A paint manufacturer is interested in knowing how much pressure (in pounds per square inch, PSI) builds up inside aerosol cans at various temperatures (degrees Fahrenheit). It has developed the following Excel spreadsheet of the results. 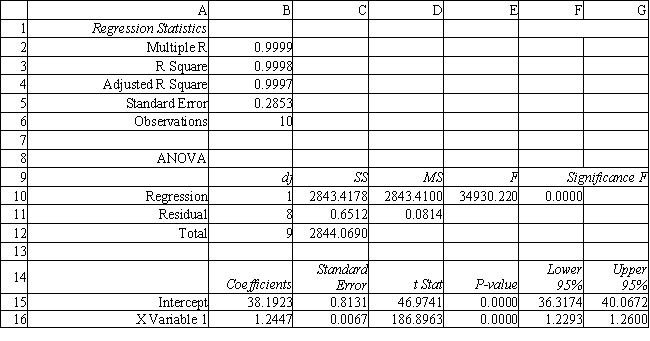
-Refer to Exhibit 9.2. Interpret the meaning of R Square in cell B3 of the spreadsheet.
Correct Answer:
Verified
View Answer
Unlock this answer now
Get Access to more Verified Answers free of charge
Q70: Exhibit 9.1
The following questions are based on
Q71: The adjusted R2 statistic
A) is equal to
Q72: Exhibit 9.5
The following questions are based on
Q73: Exhibit 9.1
The following questions are based on
Q74: Exhibit 9.2
The following questions are based on
Q76: Exhibit 9.6
The partial regression output below applies
Q77: Regression analysis is a modeling technique
A) that
Q78: Exhibit 9.7
The partial regression output below applies
Q79: Exhibit 9.3
The following questions are based on
Q80: Exhibit 9.7
The partial regression output below applies
Unlock this Answer For Free Now!
View this answer and more for free by performing one of the following actions

Scan the QR code to install the App and get 2 free unlocks

Unlock quizzes for free by uploading documents