Exhibit 9.1
The following questions are based on the problem description and spreadsheet below.
A company has built a regression model to predict the number of labor hours (Yi) required to process a batch of parts (Xi). It has developed the following Excel spreadsheet of the results. 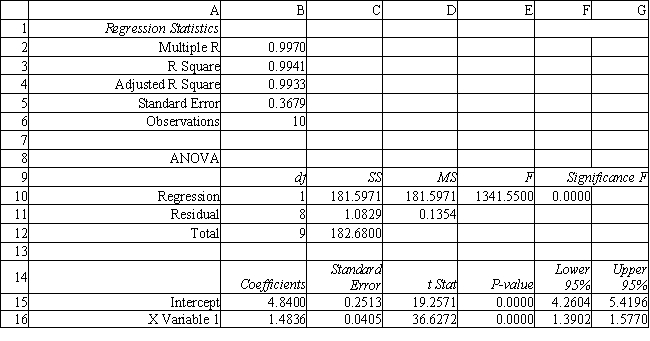
-Refer to Exhibit 9.1. Interpret the meaning of the "Lower 95%" and "Upper 95%" terms in cells F16:G16 of the spreadsheet.
Correct Answer:
Verified
View Answer
Unlock this answer now
Get Access to more Verified Answers free of charge
Q65: Estimation errors are often referred to as
A)
Q66: Exhibit 9.6
The partial regression output below applies
Q67: The company would like to build a
Q68: Exhibit 9.3
The following questions are based on
Q69: The standard error measures the
A) variability in
Q71: The adjusted R2 statistic
A) is equal to
Q72: Exhibit 9.5
The following questions are based on
Q73: Exhibit 9.1
The following questions are based on
Q74: Exhibit 9.2
The following questions are based on
Q75: Exhibit 9.2
The following questions are based on
Unlock this Answer For Free Now!
View this answer and more for free by performing one of the following actions

Scan the QR code to install the App and get 2 free unlocks

Unlock quizzes for free by uploading documents