Exhibit 9.3
The following questions are based on the problem description and spreadsheet below.
A researcher is interested in determining how many calories young men consume. She measured the age of the individuals and recorded how much food they ate each day for a month. The average daily consumption was recorded as the dependent variable. She has developed the following Excel spreadsheet of the results. 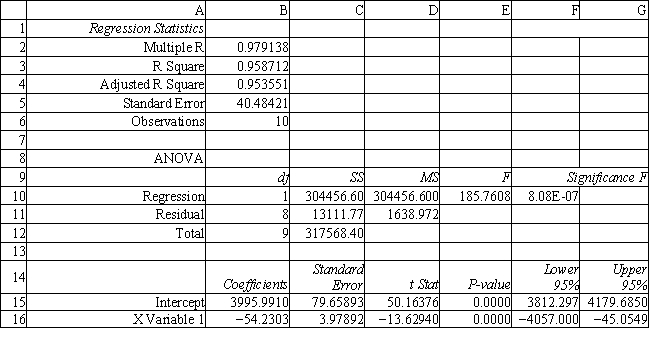
-Refer to Exhibit 9.3. Interpret the meaning of R square in cell B3 of the spreadsheet.
Correct Answer:
Verified
View Answer
Unlock this answer now
Get Access to more Verified Answers free of charge
Q58: The terms β0 and β1 are referred
Q59: What is a clear indicator of non-constant
Q60: Residuals are assumed to be
A) dependent, uniformly
Q61: How many binary variables are required to
Q62: Exhibit 9.1
The following questions are based on
Q64: Exhibit 9.1
The following questions are based on
Q65: Estimation errors are often referred to as
A)
Q66: Exhibit 9.6
The partial regression output below applies
Q67: The company would like to build a
Q68: Exhibit 9.3
The following questions are based on
Unlock this Answer For Free Now!
View this answer and more for free by performing one of the following actions

Scan the QR code to install the App and get 2 free unlocks

Unlock quizzes for free by uploading documents