Exhibit 9.1
The following questions are based on the problem description and spreadsheet below.
A company has built a regression model to predict the number of labor hours (Yi) required to process a batch of parts (Xi). It has developed the following Excel spreadsheet of the results. 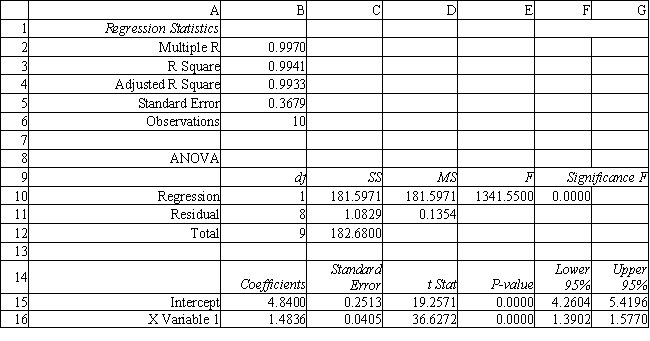
-Refer to Exhibit 9.1. What is the estimated regression function for this problem? Explain what the terms in your equation mean.
Correct Answer:
Verified
View Answer
Unlock this answer now
Get Access to more Verified Answers free of charge
Q59: What is a clear indicator of non-constant
Q60: Residuals are assumed to be
A) dependent, uniformly
Q61: How many binary variables are required to
Q62: Exhibit 9.1
The following questions are based on
Q63: Exhibit 9.3
The following questions are based on
Q65: Estimation errors are often referred to as
A)
Q66: Exhibit 9.6
The partial regression output below applies
Q67: The company would like to build a
Q68: Exhibit 9.3
The following questions are based on
Q69: The standard error measures the
A) variability in
Unlock this Answer For Free Now!
View this answer and more for free by performing one of the following actions

Scan the QR code to install the App and get 2 free unlocks

Unlock quizzes for free by uploading documents