Exhibit 9.3
The following questions are based on the problem description and spreadsheet below.
A researcher is interested in determining how many calories young men consume. She measured the age of the individuals and recorded how much food they ate each day for a month. The average daily consumption was recorded as the dependent variable. She has developed the following Excel spreadsheet of the results. 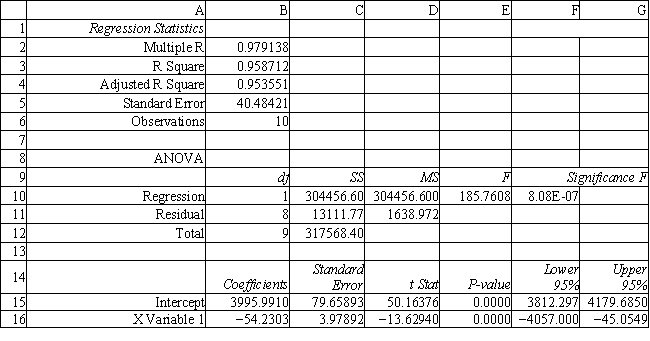
-Refer to Exhibit 9.3. Test the significance of the model and explain which values you used to reach your conclusions.
Correct Answer:
Verified
View Answer
Unlock this answer now
Get Access to more Verified Answers free of charge
Q81: Exhibit 9.4
The following questions are based on
Q82: Exhibit 9.1
The following questions are based on
Q83: Exhibit 9.3
The following questions are based on
Q84: Assume you have chosen to use all
Q85: Exhibit 9.2
The following questions are based on
Q87: Exhibit 9.4
The following questions are based on
Q88: Exhibit 9.2
The following questions are based on
Q89: The researcher would like to build a
Q90: Exhibit 9.5
The following questions are based on
Q91: Exhibit 9.1
The following questions are based on
Unlock this Answer For Free Now!
View this answer and more for free by performing one of the following actions

Scan the QR code to install the App and get 2 free unlocks

Unlock quizzes for free by uploading documents