Exhibit 9.1
The following questions are based on the problem description and spreadsheet below.
A company has built a regression model to predict the number of labor hours (Yi) required to process a batch of parts (Xi). It has developed the following Excel spreadsheet of the results. 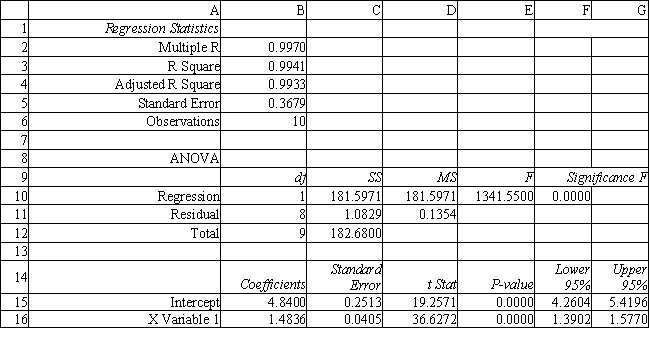
-Refer to Exhibit 9.1. Interpret the meaning of R Square in cell B3 of the spreadsheet.
Correct Answer:
Verified
View Answer
Unlock this answer now
Get Access to more Verified Answers free of charge
Q83: Exhibit 9.3
The following questions are based on
Q84: Assume you have chosen to use all
Q85: Exhibit 9.2
The following questions are based on
Q86: Exhibit 9.3
The following questions are based on
Q87: Exhibit 9.4
The following questions are based on
Q88: Exhibit 9.2
The following questions are based on
Q89: The researcher would like to build a
Q90: Exhibit 9.5
The following questions are based on
Q92: The company would like to build a
Q93: Exhibit 9.2
The following questions are based on
Unlock this Answer For Free Now!
View this answer and more for free by performing one of the following actions

Scan the QR code to install the App and get 2 free unlocks

Unlock quizzes for free by uploading documents