Exhibit 13.4
The following questions refer to the information and output below.
A grocery store can serve an average of 360 customers per hour. The service times are exponentially distributed. The store has 4 checkout lines each of which serves 90 customers per hour. Customers arrive at the store at a Poisson rate of 240 customers per hour. The following queuing analysis spreadsheet was developed from this information. 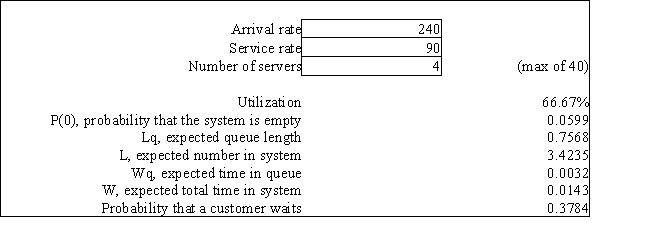
-Refer to Exhibit 13.4. Based on this report how long does a customer wait before the checker begins serving them?
Correct Answer:
Verified
Q86: Exhibit 13.6
The following questions refer to the
Q87: Exhibit 13.7
The following questions refer to the
Q88: Exhibit 13.2
The following questions refer to the
Q89: Exhibit 13.2
The following questions refer to the
Q90: Exhibit 13.5
The following questions refer to the
Q92: What is the mean arrival rate based
Q93: Exhibit 13.2
The following questions refer to the
Q94: Customers arrive at a store randomly, following
Q95: A grocery clerk can serve 20 customers
Q96: Exhibit 13.3
The following questions refer to the
Unlock this Answer For Free Now!
View this answer and more for free by performing one of the following actions

Scan the QR code to install the App and get 2 free unlocks

Unlock quizzes for free by uploading documents