Exhibit 13.7
The following questions refer to the information and output below.
A tax accountant has found that the time to serve a customer has a mean of 30 minutes (or 0.5 hours) and a standard deviation of 6 minutes (or 0.1 hours). Customer arrivals follow a Poisson distribution with an average of 60 minutes between arrivals. The following queuing analysis spreadsheet was developed from this information. 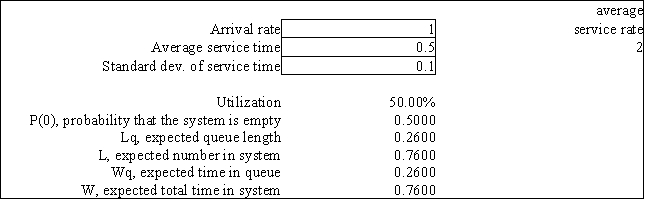
-Refer to Exhibit 13.7. Based on this report what is the probability that a customer does not have to wait for assistance with his or her taxes?
Correct Answer:
Verified
Q82: Exhibit 13.5
The following questions refer to the
Q83: Exhibit 13.7
The following questions refer to the
Q84: Exhibit 13.3
The following questions refer to the
Q85: Exhibit 13.2
The following questions refer to the
Q86: Exhibit 13.6
The following questions refer to the
Q88: Exhibit 13.2
The following questions refer to the
Q89: Exhibit 13.2
The following questions refer to the
Q90: Exhibit 13.5
The following questions refer to the
Q91: Exhibit 13.4
The following questions refer to the
Q92: What is the mean arrival rate based
Unlock this Answer For Free Now!
View this answer and more for free by performing one of the following actions

Scan the QR code to install the App and get 2 free unlocks

Unlock quizzes for free by uploading documents