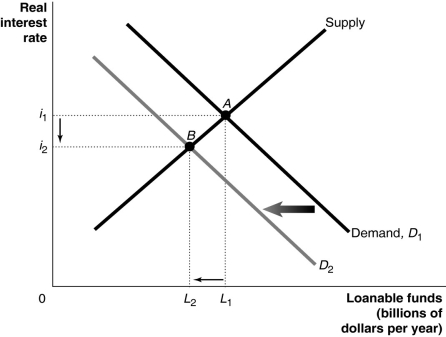
Figure 21-2 
-Refer to Figure 21-2.Which of the following is consistent with the graph depicted above?
A) An expected expansion increases the profitability of new investment.
B) The government runs a budget surplus.
C) There is a shift from an income tax to a consumption tax.
D) New government regulations decrease the profitability of new investment.
Correct Answer:
Verified
Q103: Figure 21-3 Q104: If net taxes fall by $80 billion,we Q105: The Congressional Budget Office reported that federal Q106: Which of the following would encourage economic Q106: In comparison to a government that runs Q109: The Congressional Budget Office reported that federal Q111: Which of the following will not occur Q114: The response of investment spending to an Q115: Figure 21-5 Q117: Figure 21-4 Unlock this Answer For Free Now! View this answer and more for free by performing one of the following actions Scan the QR code to install the App and get 2 free unlocks Unlock quizzes for free by uploading documents![]()
![]()
![]()

