Figure 1.1 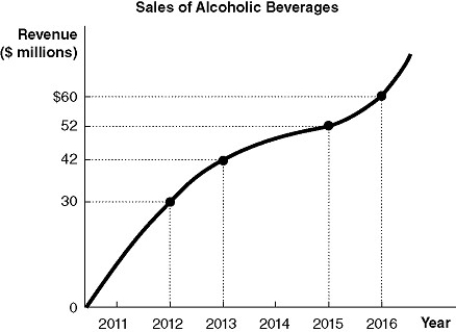
-Refer to Figure 1-1.Using the information in the figure above,calculate the percentage change in sales of alcoholic beverages between 2013 and 2015.
A) 23.8%
B) 40%
C) 42.9%
D) 73.3%
Correct Answer:
Verified
Q192: Two-dimensional graphs have a horizontal and a
Q205: If a graph has a line that
Q215: In 2015, Hooverville consumed 205,000 tons of
Q217: On a two-dimensional graph, _ allows for
Q224: Figure 1-1 Q225: Which of the following statements is false? Q226: Suppose when the price of laptops fall, Q228: Figure 1-3 Q232: In 2015, Smileytown consumed 12,000 gallons of Q238: Figure 1-2 Unlock this Answer For Free Now! View this answer and more for free by performing one of the following actions Scan the QR code to install the App and get 2 free unlocks Unlock quizzes for free by uploading documents
![]()
A)An
![]()
![]()

