The figure below shows the demand (D) and supply (S) curves of corn syrups. Figure 35.3 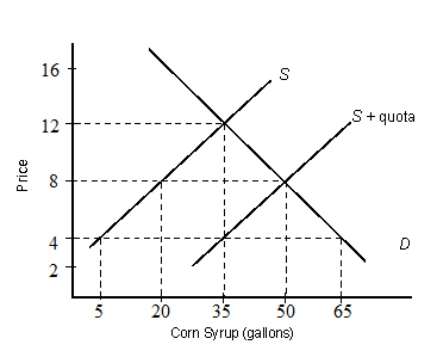 In Figure 35.3, if the world price per gallon is $8, then without quotas:
A) 50 gallons of corn syrup will be imported.
B) 35 gallons of corn syrup will be imported.
C) 30 gallons of corn syrup will be imported.
D) 20 gallons of corn syrup will be imported.
E) 45 gallons of corn syrup will be imported.
Correct Answer:
Verified
Q55: The figure below shows the demand (D)and
Q56: Which of the following countries is forbidden
Q58: The figure given below depicts the negatively
Q59: The figure given below depicts the negatively
Q60: The figure given below depicts the negatively
Q64: One of the negative impacts of export
Q68: The most successful free trade agreements achieve
Q72: The trade-creation effect refers to:
A)a reduction in
Q74: The basic difference between a tariff and
Q78: A customs union is an organization of
Unlock this Answer For Free Now!
View this answer and more for free by performing one of the following actions

Scan the QR code to install the App and get 2 free unlocks

Unlock quizzes for free by uploading documents