The figure below shows the demand (D) and supply (S) curves of corn syrups. Figure 35.3 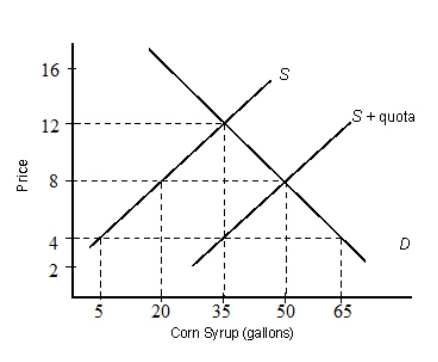 In Figure 35.3, with an import quota of 30 gallons of corn syrup, what is the new equilibrium quantity demanded?
A) 35 gallons
B) 50 gallons
C) 20 gallons
D) 65 gallons
E) 5 gallons
Correct Answer:
Verified
Q50: The figure given below depicts the negatively
Q51: The figure given below depicts the negatively
Q52: The figure below shows the demand (D)and
Q53: The figure given below depicts the negatively
Q54: The figure given below depicts the negatively
Q56: Which of the following countries is forbidden
Q58: The figure given below depicts the negatively
Q59: The figure given below depicts the negatively
Q60: The figure given below depicts the negatively
Q60: The figure below shows the demand (D)and
Unlock this Answer For Free Now!
View this answer and more for free by performing one of the following actions

Scan the QR code to install the App and get 2 free unlocks

Unlock quizzes for free by uploading documents