The figure given below shows the demand curve in the U.S.and the cost curves in U.S.and India. Figure: 29.4 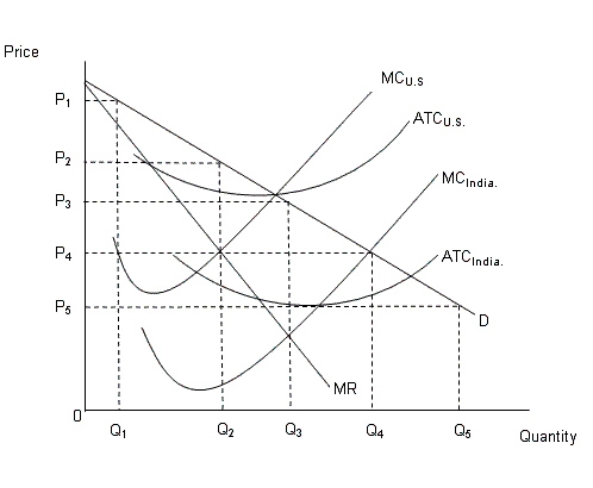 In the figure:
MC: Marginal cost curve
ATC: Average total cost curve
D: Demand curve in the U.S.
MR: Marginal revenue curve in the U.S.
In Figure 29.4, the price and quantity of the good if produced by India would be _____ and _____ respectively.
A) P3;Q3
B) P4;Q4
C) P1;Q1
D) P5;Q5
E) P2;Q2
Correct Answer:
Verified
Q26: According to Figure 29.4, one of the
Q26: The U.S.government has time and again raised
Q27: Why has the inequality of income become
Q28: If the supply of skilled workers is
Q29: A college student's choice of a major
Q30: An individual is induced to change his/her
Q32: Investment in human capital implies:
A)investment on machines,technological
Q33: Why are a large number of IT
Q33: The following figures show the demand and
Q37: Which of the following statements is true?
A)Income
Unlock this Answer For Free Now!
View this answer and more for free by performing one of the following actions

Scan the QR code to install the App and get 2 free unlocks

Unlock quizzes for free by uploading documents