The figure given below shows the income-leisure trade off of an individual. Figure 29.6 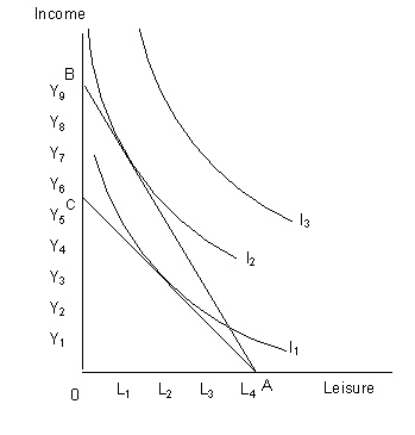 AB and AC: Income constraints of the individual
I1, I2, and I3 curves show the income leisure choices of the individual.
In Figure 29.6, if the income constraint of the individual is given by the line AB, he maximizes his utility by choosing _____ hours of leisure and earns an income of _____.
A) 0;Y2
B) L1;Y7
C) L2;Y5
D) L3;Y4
E) L4;Y7
Correct Answer:
Verified
Q41: The figure given below shows the income-leisure
Q45: The following figures show the demand and
Q45: The figure given below shows the income-leisure
Q46: The figure given below shows the income-leisure
Q48: The figure given below shows the income-leisure
Q50: The figure given below shows the income-leisure
Q54: The figure given below shows the income-leisure
Q55: Which of the following is true of
Q58: If the tax rate increases with increase
Q60: The figure given below shows the demand
Unlock this Answer For Free Now!
View this answer and more for free by performing one of the following actions

Scan the QR code to install the App and get 2 free unlocks

Unlock quizzes for free by uploading documents