The figure given below shows the demand and supply curves of steel.Sp is the private supply curve, and Ss is the social supply curve that includes both private costs and external costs. Figure 13.2 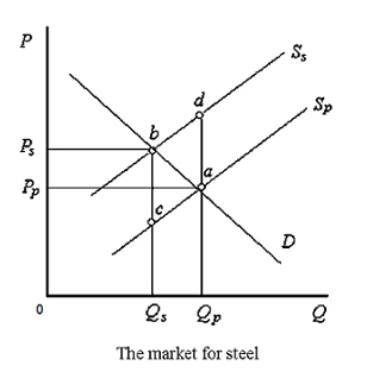 According to Figure 13.2:
A) both points a and b are socially efficient.
B) both points a and b are inefficient.
C) point a represents the social equilibrium, whereas point b represents the private equilibrium.
D) point a represents the private equilibrium, whereas point b represents the social equilibrium.
E) when external costs are zero, the socially efficient output level is equal to 0Qs units.
Correct Answer:
Verified
Q46: The Clean Air Act of 1972 required
Q54: The European Union Emission Trading Scheme is
Q54: The figure given below shows the demand
Q56: The figure given below shows the demand
Q56: Which of the following is an example
Q58: The figure given below shows the demand
Q60: When the government imposes a tax on
Q65: If the value of a network to
Q75: When each additional resource adds increasing amounts
Q78: Suppose the wheat industry is in long-run
Unlock this Answer For Free Now!
View this answer and more for free by performing one of the following actions

Scan the QR code to install the App and get 2 free unlocks

Unlock quizzes for free by uploading documents