The figure given below shows the demand and supply curves of automobiles. Figure 13.3 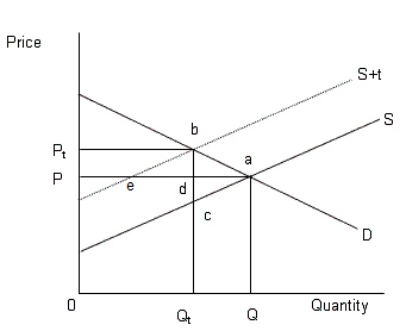 In the figure,
D: Demand curve of automobiles
S: Supply of automobiles prior to the tax
S+t: Supply of automobiles after the tax
According to Figure 13.3, the market attains equilibrium before the tax at:
A) point d.
B) point a.
C) point b.
D) point c.
E) point e.
Correct Answer:
Verified
Q45: When the government tries to control pollution
Q46: The Clean Air Act of 1972 required
Q51: The figure given below shows the demand
Q54: The figure given below shows the demand
Q54: The European Union Emission Trading Scheme is
Q56: Which of the following is an example
Q58: The figure given below shows the demand
Q58: The figure given below shows the demand
Q60: When the government imposes a tax on
Q78: Suppose the wheat industry is in long-run
Unlock this Answer For Free Now!
View this answer and more for free by performing one of the following actions

Scan the QR code to install the App and get 2 free unlocks

Unlock quizzes for free by uploading documents