The figure given below shows the demand and supply curves of automobiles. Figure 13.3 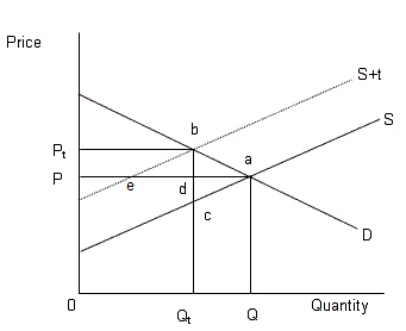 In the figure,
D: Demand curve of automobiles
S: Supply of automobiles prior to the tax
S+t: Supply of automobiles after the tax
Figure 13.3 represents a situation of:
A) positive externality.
B) Pareto efficiency.
C) negative externality.
D) tragedy of commons.
E) free rider problem.
Correct Answer:
Verified
Q41: The figure given below shows the demand
Q45: When the government tries to control pollution
Q46: The figure given below shows the demand
Q48: The figure given below shows the demand
Q53: If education has positive externalities:
A)the private market
Q54: The figure given below shows the demand
Q56: The figure given below shows the demand
Q58: The figure given below shows the demand
Q60: When the government imposes a tax on
Q79: ![]()
Unlock this Answer For Free Now!
View this answer and more for free by performing one of the following actions

Scan the QR code to install the App and get 2 free unlocks

Unlock quizzes for free by uploading documents