The figure below shows the revenue and cost curves of a monopolistically competitive firm. Figure 25.2 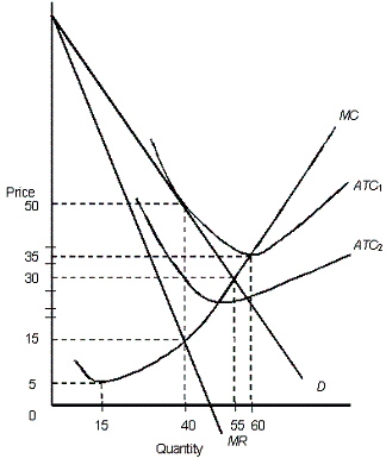 In the figure,
D: Demand curve
MR: Marginal revenue curve
ATC1 and ATC2: Average total cost curves
MC: Marginal cost curve
In Figure 25.2, assume that the average total cost of the firm is represented by the curve ATC2.In the long run, we would expect:
A) entry of firms into the market because economic profits exist.
B) exit of firms from the market because the existing firms suffer economic losses.
C) that demand for each firm will increase.
D) the market to become perfectly competitive.
E) the market to become a monopoly.
Correct Answer:
Verified
Q1: The major similarity between a monopolist and
Q3: The short-run equilibrium position for a firm
Q3: The figure given below shows the cost
Q4: When the existing firms in a monopolistically
Q5: Which of the following statements about the
Q8: A monopolistically competitive market is characterized by:
A)one
Q11: The figure below shows the revenue and
Q12: In a certain monopolistically competitive market that
Q13: In the short run,a monopolistically competitive firm:
A)can
Q18: The figure given below shows the cost
Unlock this Answer For Free Now!
View this answer and more for free by performing one of the following actions

Scan the QR code to install the App and get 2 free unlocks

Unlock quizzes for free by uploading documents