The table below shows the distribution of income in the U.S.in the year 1978. Table 19.1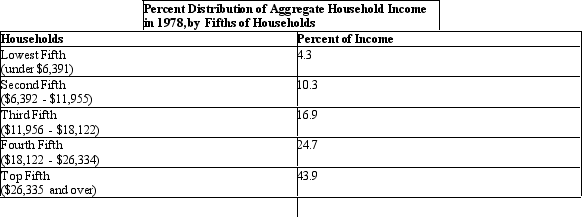 According to Table 19.1, what percentage of income is received by the top 40% of the population?
A) 41.6%
B) 51.9%
C) 60.8%
D) 56.2%
E) 68.6%
Correct Answer:
Verified
Q5: The greater the value of the Gini
Q8: The table below shows the distribution of
Q8: Gini co-efficient is the:
A)area between the Lorenz
Q10: If 50 percent of the population receives
Q11: If the Gini coefficient for the United
Q11: The table below shows the distribution of
Q17: The figure given below represents an imperfectly
Q17: Which of the following results from the
Q18: The figure given below represents an imperfectly
Q20: If the Gini co-efficient for any economy
Unlock this Answer For Free Now!
View this answer and more for free by performing one of the following actions

Scan the QR code to install the App and get 2 free unlocks

Unlock quizzes for free by uploading documents