The table below shows the distribution of income in the U.S.in the year 1978. Table 19.1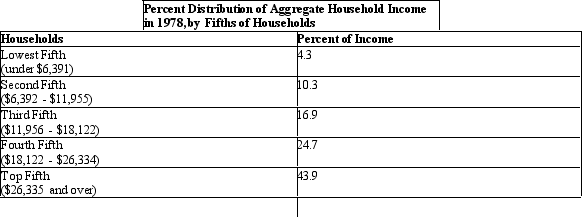 Refer to Table 19.1.What percentage of households earn 31.5% of the income?
A) Bottom 20%
B) Top 20%
C) Bottom 60%
D) Top 40%
E) Top 10%
Correct Answer:
Verified
Q3: The figure given below represents an imperfectly
Q3: In Country X,the highest 10 percent of
Q4: Empirical observations validate that the Gini co-efficient
Q10: If 50 percent of the population receives
Q11: The figure given below represents an imperfectly
Q11: The table below shows the distribution of
Q11: If the Gini coefficient for the United
Q13: The table below shows the distribution of
Q15: A Gini of 0 implies:
A)every family has
Q20: If the Gini co-efficient for any economy
Unlock this Answer For Free Now!
View this answer and more for free by performing one of the following actions

Scan the QR code to install the App and get 2 free unlocks

Unlock quizzes for free by uploading documents