The figure below shows two Lorenz curves, Y and Z. Figure 19.1 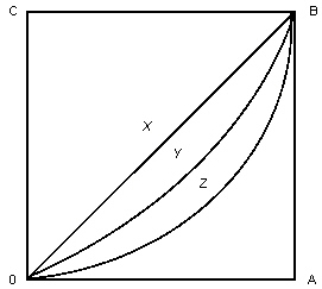 In Figure 19.1, which of the following could occur in the short run given the introduction of a regressive income tax?
A) The Lorenz curve OZB would shift to OYB.
B) The Lorenz curve OYB would coincide with the line OXB.
C) The Lorenz curve OZB would coincide with the line OXB.
D) The Lorenz curve OYB would coincide with the horizontal axis.
E) The Lorenz curve would shift from OYB to OZB.
Correct Answer:
Verified
Q20: The table below shows the distribution of
Q22: The figure given below shows the Lorenz
Q23: The figure given below shows the Lorenz
Q25: The figure given below shows the Lorenz
Q26: Which of the following refers to per
Q27: The figure given below shows the Lorenz
Q30: The figure given below shows the Lorenz
Q35: The figure given below shows the Lorenz
Q38: The figure given below shows the Lorenz
Q42: The figure given below shows the Lorenz
Unlock this Answer For Free Now!
View this answer and more for free by performing one of the following actions

Scan the QR code to install the App and get 2 free unlocks

Unlock quizzes for free by uploading documents