The figure given below shows the Lorenz curves of two countries (Country A and Country B) . Figure 19.2
Total income (cumulative percentage) 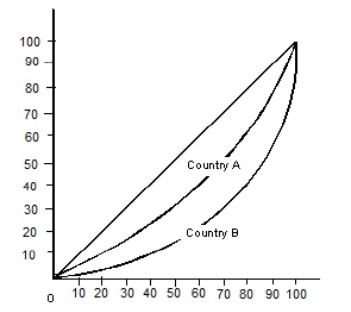 Total population (cumuative percentage)
In Figure 19.2, the richest 20 percent of the population in Country B receive:
A) 20 percent of the national income.
B) 60 percent of the national income.
C) 50 percent of the national income.
D) 40 percent of the national income.
E) 80 percent of the national income.
Correct Answer:
Verified
Q5: The greater the value of the Gini
Q13: The figure given below represents an imperfectly
Q17: Which of the following results from the
Q20: The table below shows the distribution of
Q23: The figure given below shows the Lorenz
Q25: The figure given below shows the Lorenz
Q25: The figure below shows two Lorenz curves,
Q26: Which of the following refers to per
Q27: The figure given below shows the Lorenz
Q30: The figure given below shows the Lorenz
Unlock this Answer For Free Now!
View this answer and more for free by performing one of the following actions

Scan the QR code to install the App and get 2 free unlocks

Unlock quizzes for free by uploading documents