The figure given below shows the demand (D1 and D2) and supply (S) curves of medical care. Figure 18.1 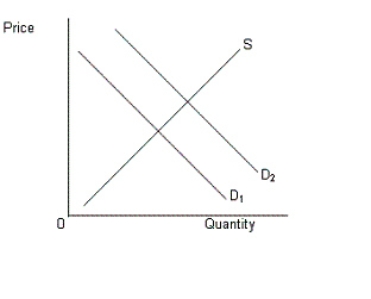 Refer to Figure 18.1.One possible reason for the shift of the demand curve from D1 to D2 is the:
A) increase in the cost of producing new drugs.
B) restriction imposed by the government on the sale of new drugs.
C) emergence of Medicare and Medicaid programs of the U.S.government.
D) economies of scale experienced while producing medical care.
E) decrease in the cost of producing medical care.
Correct Answer:
Verified
Q24: Medicare is a federal program that provides
Q26: The figure given below represents demand for
Q26: The American Medical Association helps increase:
A)price competition
Q29: _ account for a majority of the
Q30: The bulk of the cost of hospital
Q31: What is the effect of the aging
Q35: "Rising health care costs might be considered
Q36: Which of the following has resulted from
Q37: Which of the following is a consequence
Q39: Which of the following is a joint
Unlock this Answer For Free Now!
View this answer and more for free by performing one of the following actions

Scan the QR code to install the App and get 2 free unlocks

Unlock quizzes for free by uploading documents