The figure given below represents demand for and supply of hospital beds in Anytown, U.S.A. , as shown by curves D and S1 in the following figure.If the hospital receives permission to expand, its new supply curve will be S2.Price level P1 is the fixed prospective payment reimbursement rate paid by Medicare to the hospital, regardless of actual cost. Figure 18.3 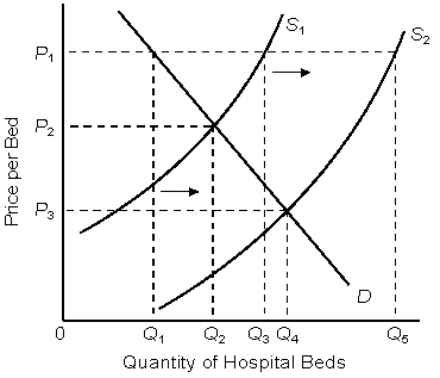 According to Figure 18.3, the surplus of beds caused by the fixed reimbursement rate, before the hospital expansion, is the difference between _____ and _____.
A) Q2;Q1
B) Q4;Q1
C) Q4;Q2
D) Q3;Q1
E) Q3;Q2
Correct Answer:
Verified
Q25: The figure given below shows the demand
Q25: Which of the following has led to
Q29: _ account for a majority of the
Q31: What is the effect of the aging
Q31: The figure given below shows the demand
Q33: Empirical evidence suggests that the aging of
Q37: Which of the following is a consequence
Q38: Physicians' fees have risen rapidly in the
Q39: Which of the following is a joint
Q40: The American Medical Association's payment system is
Unlock this Answer For Free Now!
View this answer and more for free by performing one of the following actions

Scan the QR code to install the App and get 2 free unlocks

Unlock quizzes for free by uploading documents