The figure given below shows the demand (D) and supply (S1 and S2) curves of medical care. Figure 18.2 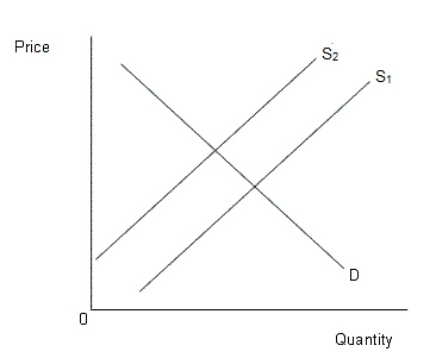 Refer to Figure 18.1.The possible reason behind the shift of the supply curve from S1 to S2 is:
A) increased preference for herbal medicine among the people.
B) increase in the marginal cost of producing medical care.
C) increase in the per capita income of the people.
D) economies of scale being experienced in the production of medical care.
E) greater health consciousness among the people.
Correct Answer:
Verified
Q5: One of the myths about social security
Q25: Which of the following has led to
Q26: The figure given below represents demand for
Q29: _ account for a majority of the
Q31: What is the effect of the aging
Q33: Empirical evidence suggests that the aging of
Q37: Which of the following is a consequence
Q38: Physicians' fees have risen rapidly in the
Q39: Which of the following is a joint
Q40: The American Medical Association's payment system is
Unlock this Answer For Free Now!
View this answer and more for free by performing one of the following actions

Scan the QR code to install the App and get 2 free unlocks

Unlock quizzes for free by uploading documents