The figure given below shows the demand curve in the U.S.and the cost curves in U.S.and India. Figure: 15.4 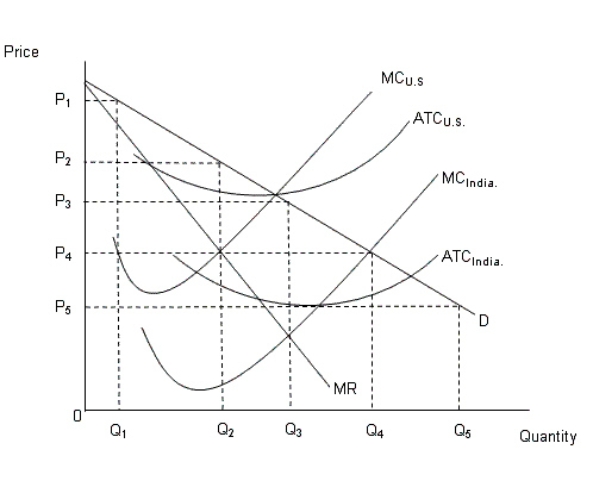 In the figure:
MC: Marginal cost curve
ATC: Average total cost curve
D: Demand curve in the U.S.
MR: Marginal revenue curve in the U.S.
-According to Figure 15.4,one of the possible outcomes of such offshoring is that:
A) the price of the good in question rises in the U.S.market.
B) the demand for Indian labor declines.
C) the demand for U.S.workers increase.
D) the price of the good in question rises in the Indian market.
E) the Indian workers replace the U.S.workers.
Correct Answer:
Verified
Q12: The figure below shows the supply curve
Q16: Which of the following is a true
Q17: The term compensating wage differential refers to:
A)the
Q19: The figure below shows the supply curve
Q20: As the wage rate increases,the quantity supplied
Q23: The intention of a minimum wage is
Q24: Minimum wage legislation by the government would:
A)create
Q25: The figures given below show the demand
Q26: The U.S.government has time and again raised
Q36: The figures given below show the demand
Unlock this Answer For Free Now!
View this answer and more for free by performing one of the following actions

Scan the QR code to install the App and get 2 free unlocks

Unlock quizzes for free by uploading documents