The following figures show the demand and supply of labor in two different types of labor market. Figure 15.5 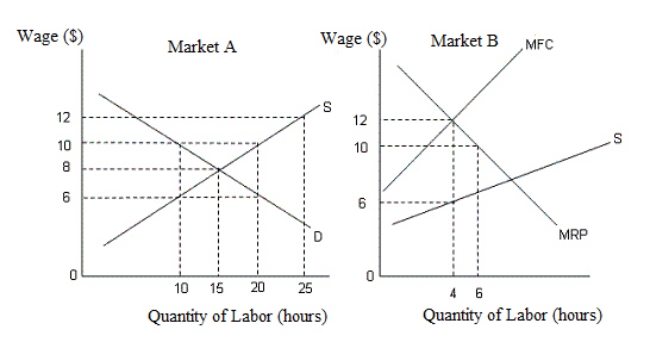 In the figures,
D: Demand curve for labor
S: Supply curve of labor
MRP: Marginal revenue product
MFC: Marginal factor cost
The Market B described in Figure 15.5 is a(n) :
A) perfectly competitive labor market.
B) monopolist market.
C) oligopolistic market.
D) monoposonistic market.
E) monopolistically competitive market.
Correct Answer:
Verified
Q21: The figure given below shows the demand
Q23: The intention of a minimum wage is
Q33: Why are a large number of IT
Q33: The following figures show the demand and
Q36: The figures given below show the demand
Q37: Which of the following statements is true?
A)Income
Q39: The figure given below shows the demand
Q41: The figure given below shows the income-leisure
Q50: The figure given below shows the income-leisure
Q51: The figure given below shows the income-leisure
Unlock this Answer For Free Now!
View this answer and more for free by performing one of the following actions

Scan the QR code to install the App and get 2 free unlocks

Unlock quizzes for free by uploading documents