The figure given below shows the demand curve in the U.S.and the cost curves in U.S.and India. Figure: 15.4 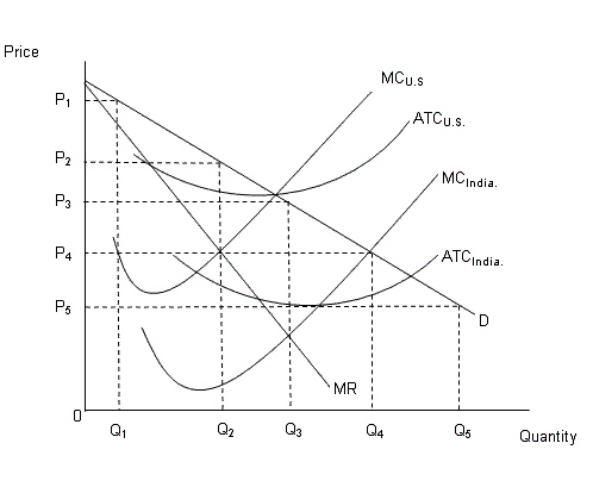 In the figure:
MC: Marginal cost curve
ATC: Average total cost curve
D: Demand curve in the U.S.
MR: Marginal revenue curve in the U.S.
In Figure 15.4, the price and quantity of the good if produced by India would be _____ and _____ respectively.
A) P3;Q3
B) P4;Q4
C) P1;Q1
D) P5;Q5
E) P2;Q2
Correct Answer:
Verified
Q21: The figure given below shows the demand
Q23: The intention of a minimum wage is
Q33: Why are a large number of IT
Q36: The figures given below show the demand
Q37: Which of the following statements is true?
A)Income
Q38: The following figures show the demand and
Q41: The figure given below shows the income-leisure
Q50: The figure given below shows the income-leisure
Q51: The figure given below shows the income-leisure
Q60: The figure given below shows the demand
Unlock this Answer For Free Now!
View this answer and more for free by performing one of the following actions

Scan the QR code to install the App and get 2 free unlocks

Unlock quizzes for free by uploading documents