The following figures show the demand and supply of labor in two different types of labor market. Figure 15.5 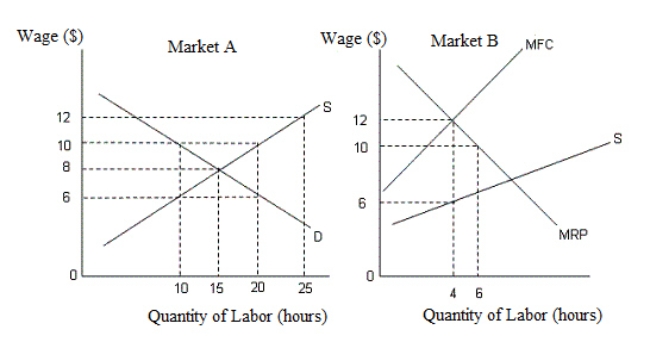 In the figures,
D: Demand curve for labor
S: Supply curve of labor
MRP: Marginal revenue product
MFC: Marginal factor cost
In Figure 15.5, if a minimum wage of $10 is set by the government, then in market B:
A) wage increases but labor employment decreases.
B) wage increases but labor employment remains constant.
C) wage decreases from $12 to $10.
D) both wage and employment increase.
E) both wage and employment decrease.
Correct Answer:
Verified
Q43: The figure given below shows the income-leisure
Q45: The figure given below shows the income-leisure
Q46: The figure given below shows the income-leisure
Q47: The following figures show the demand and
Q50: The figure given below shows the income-leisure
Q53: The burden of a tax is mainly
Q54: The figure given below shows the income-leisure
Q55: Which of the following is true of
Q56: The figure given below shows the demand
Q58: If the tax rate increases with increase
Unlock this Answer For Free Now!
View this answer and more for free by performing one of the following actions

Scan the QR code to install the App and get 2 free unlocks

Unlock quizzes for free by uploading documents