The figure given below depicts the long run equilibrium in an economy. Figure 14.1 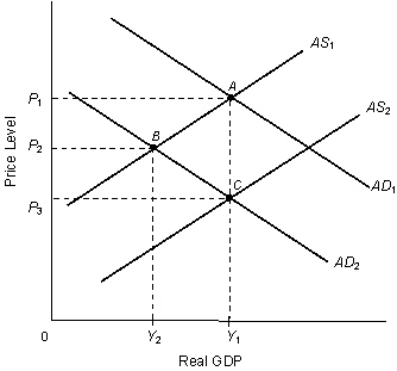 In the figure:
AD1 and AD2: Aggregate demand curves
AS1 and AS2: Aggregate supply curves
Refer to Figure 14.1.When the economy moves from point B to point C:
A) both the unemployment rate and the rate of inflation increases.
B) both the unemployment rate and the rate of inflation declines.
C) the unemployment rate declines at the cost of higher inflation.
D) the rate of inflation declines at the cost of a higher unemployment rate.
E) the rate of inflation declines with no change in the unemployment rate.
Correct Answer:
Verified
Q1: According to the long-run Phillips curve, which
Q2: The figure given below depicts the long
Q3: The key feature due to which unexpected
Q5: If the short-run Phillips curve shifts to
Q6: The slope of the short-run Phillips curve
Q7: The figure given below shows the Phillips
Q8: What is the difference between the short-run
Q9: The figure given below shows the Phillips
Q10: In the short run, an expansionary monetary
Q11: The long-run aggregate supply curve at potential
Unlock this Answer For Free Now!
View this answer and more for free by performing one of the following actions

Scan the QR code to install the App and get 2 free unlocks

Unlock quizzes for free by uploading documents