The figure given below shows the Phillips curves of the U.S.economy during early 1960s to late 1970s. Figure 14.2 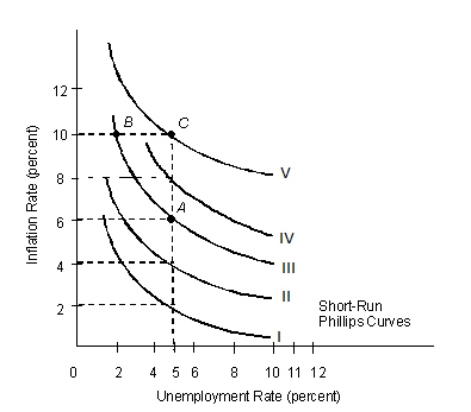 Refer to Figure 14.2.Phillips curve II is associated with the late 1980s in the United States and indicates that 5 percent unemployment was consistent with 4 percent inflation.Which curve would be associated with the late 1970s in the United States?
A) I
B) II
C) III
D) IV
E) V
Correct Answer:
Verified
Q4: The figure given below depicts the long
Q5: If the short-run Phillips curve shifts to
Q6: The slope of the short-run Phillips curve
Q7: The figure given below shows the Phillips
Q8: What is the difference between the short-run
Q10: In the short run, an expansionary monetary
Q11: The long-run aggregate supply curve at potential
Q12: Consider a nation experiencing the relationship illustrated
Q13: Which of the following is most likely
Q14: The figure given below depicts the long
Unlock this Answer For Free Now!
View this answer and more for free by performing one of the following actions

Scan the QR code to install the App and get 2 free unlocks

Unlock quizzes for free by uploading documents