The figure below shows the revenue and cost curves of a monopolistically competitive firm. Figure: 11.2 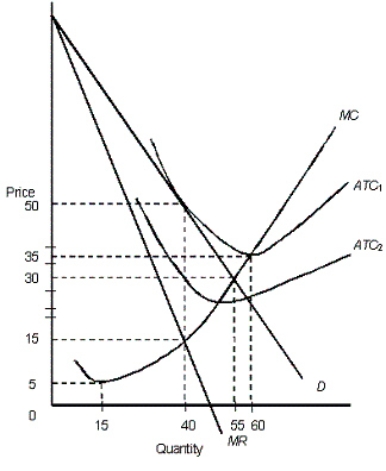 In the figure,
D: Demand curve
MR: Marginal revenue curve
ATC1 and ATC2: Average total cost curves
MC: Marginal cost curve
In Figure 11.2, assume that the average total cost of the firm is represented by the curve ATC2.In the long run, we would expect:
A) entry of firms into the market because economic profits exist.
B) exit of firms from the market because the existing firms suffer economic losses.
C) that demand for each firm will increase.
D) the market to become perfectly competitive.
E) the market to become a monopoly.
Correct Answer:
Verified
Q1: The major similarity between a monopolist and
Q6: The figure given below shows the cost
Q7: According to Figure 11.1,the profit-maximizing firm is
Q7: The figure below shows the revenue and
Q11: The figure given below shows the cost
Q13: In the short run,a monopolistically competitive firm:
A)can
Q14: Monopolistic competition is similar to perfect competition
Q16: The market structure called monopolistic competition is
Q18: The figure given below shows the cost
Q38: The figure below shows the revenue and
Unlock this Answer For Free Now!
View this answer and more for free by performing one of the following actions

Scan the QR code to install the App and get 2 free unlocks

Unlock quizzes for free by uploading documents