The following figure shows the revenue curves of a monopolist: Figure 10.6 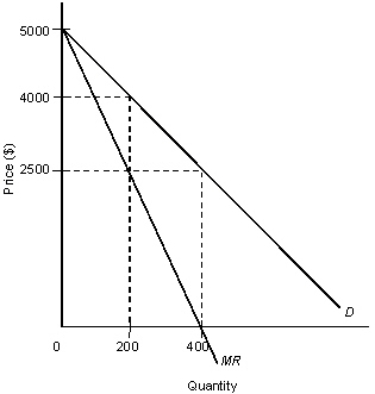 D: Average revenue
MR: Marginal revenue
In Figure 10.6, assume that marginal costs are constant at $2, 500 and fixed costs are zero.What price and output level would result from perfect competition?
A) P = $2, 500, Q = 400
B) P = $2, 500, Q = 200
C) P = $5, 000, Q = 0
D) P = $4, 000, Q = 400
E) P = $4, 000, Q = 200
Correct Answer:
Verified
Q68: The figure given below shows the demand
Q70: The efficiency loss that occurs when a
Q73: The figure given below shows the demand
Q74: The following figures show the demand and
Q74: The figure given below shows the demand
Q75: The following figures show the demand and
Q78: The following table shows the marginal revenues
Q79: The following figure shows the revenue curves
Q80: The figure given below shows the demand
Q92: The figure given below shows the cost
Unlock this Answer For Free Now!
View this answer and more for free by performing one of the following actions

Scan the QR code to install the App and get 2 free unlocks

Unlock quizzes for free by uploading documents