The figure given below shows the demand curves of two classes of buyers for tickets to a football match. Figure 10.4 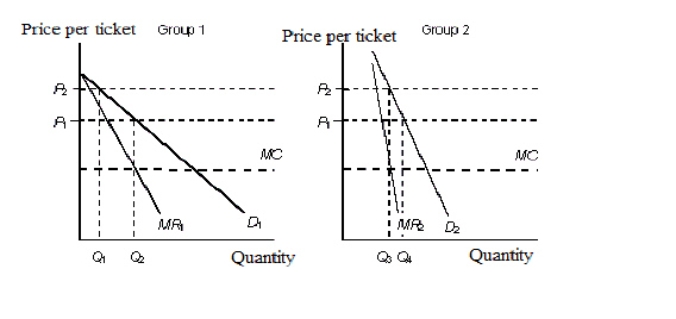 D1: Demand curve of group 1
D2: Demand curve of group 2
MR1: Marginal revenue of group 1
MR2: Marginal revenue of group 2
MC: Marginal cost
In Figure 10.4, the demand curve D2:
A) has a price elasticity of demand greater than 1.
B) is relatively less price elastic than D1.
C) is the inverse of the demand curve D1.
D) has a price elasticity of demand less than 1.
E) represents the demand of the group that is more responsive to price changes.
Correct Answer:
Verified
Q64: Movie theaters are able to offer discounts
Q65: Perfect price discrimination occurs when:
A)each customer is
Q68: The figure given below shows the demand
Q68: The following figure shows the revenue curves
Q70: The efficiency loss that occurs when a
Q74: The figure given below shows the demand
Q74: The following figures show the demand and
Q75: The following figures show the demand and
Q76: The following figure shows the revenue curves
Q78: The following table shows the marginal revenues
Unlock this Answer For Free Now!
View this answer and more for free by performing one of the following actions

Scan the QR code to install the App and get 2 free unlocks

Unlock quizzes for free by uploading documents