The following figure shows the revenue curves of a monopolist: Figure 10.6 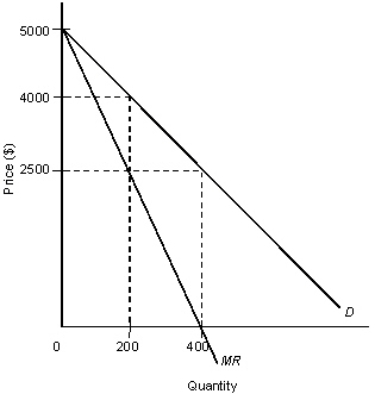 D: Average revenue
MR: Marginal revenue
Refer to Figure 10.6.Assume that marginal costs are constant at $2, 500 and fixed costs are zero.Under a monopoly, consumer surplus would be:
A) $100, 000.
B) $500, 000.
C) $300, 000.
D) $250, 000.
E) $200, 000.
Correct Answer:
Verified
Q64: The following figures show the demand and
Q64: Movie theaters are able to offer discounts
Q65: The figure below shows the market equilibrium
Q65: Perfect price discrimination occurs when:
A)each customer is
Q66: The following figures show the demand and
Q67: The figure below shows the market equilibrium
Q68: The figure given below shows the demand
Q73: Compared with a perfectly competitive market with
Q73: The figure given below shows the demand
Q74: The figure given below shows the demand
Unlock this Answer For Free Now!
View this answer and more for free by performing one of the following actions

Scan the QR code to install the App and get 2 free unlocks

Unlock quizzes for free by uploading documents