The figure given below represents the leakages and injections in an economy. Figure 10.2 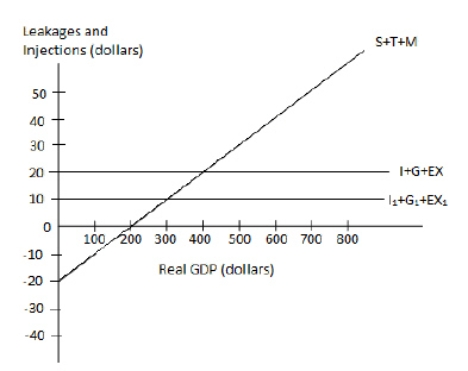 In the figure:
I, I1: Investment;
G: Government spending;
EX, EX1: Exports;
T: Taxes;and
M: Imports.
Refer to Figure 10.2.Suppose that I+G+EX equals $20 and the economy is in equilibrium.What is the amount of saving when T = $0 and M = $5 at the equilibrium level?
A) $0
B) $10
C) $15
D) $20
E) $25
Correct Answer:
Verified
Q25: Savings are good for a family.If all
Q26: Scenario 10.1 Imagine an economy that does
Q27: The percentage of a change in income
Q28: The figure given below represents the leakages
Q29: Assume that an increase of $300 in
Q31: The figure given below represents the leakages
Q32: Ceteris paribus, a downward shift in the
Q33: Scenario 10.1 Imagine an economy that does
Q34: The figure given below represents the leakages
Q35: The figure given below represents the leakages
Unlock this Answer For Free Now!
View this answer and more for free by performing one of the following actions

Scan the QR code to install the App and get 2 free unlocks

Unlock quizzes for free by uploading documents