The figure given below represents the leakages and injections in an economy. Figure 10.3 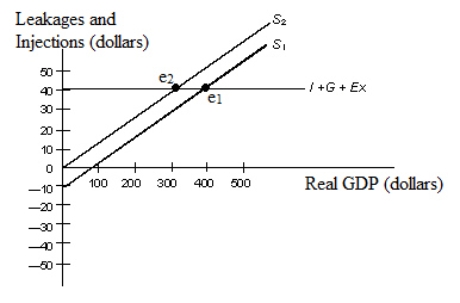 In the figure:
S1 and S2: Saving functions
I: Investment
G: Government spending
EX: Net exports
In Figure 10.3, which of the following represents the paradox of thrift?
A) A shift of the saving curve from S2 to S1.
B) A shift of the saving curve from S1 to S2.
C) A change in equilibrium from e2 to e1.
D) A change in equilibrium real GDP from $300 to $400.
E) A change in equilibrium real GDP from $100 to $400.
Correct Answer:
Verified
Q30: The figure given below represents the leakages
Q31: The figure given below represents the leakages
Q32: Ceteris paribus, a downward shift in the
Q33: Scenario 10.1 Imagine an economy that does
Q34: The figure given below represents the leakages
Q36: Suppose an economy has a government budget
Q37: The spending multiplier measures the change in
Q38: If Saving+Tax+Import > Investment+Government spending+Export, then _
Q39: Suppose an economy operates at a real
Q40: The figure given below represents the leakages
Unlock this Answer For Free Now!
View this answer and more for free by performing one of the following actions

Scan the QR code to install the App and get 2 free unlocks

Unlock quizzes for free by uploading documents