The figure given below represents the leakages and injections in an economy. Figure 10.3 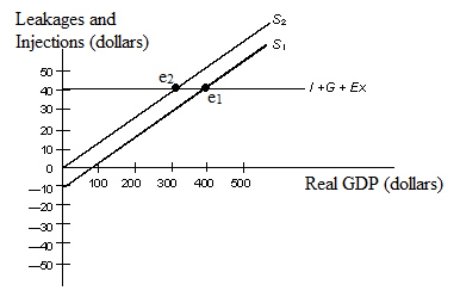 In the figure:
S1 and S2: Saving functions
I: Investment
G: Government spending
EX: Net exports
Refer to Figure 10.3.If saving is represented by S1, at a real GDP level of $500:
A) leakages are greater than injections which will cause income to increase.
B) leakages are greater than injections which will cause income to decrease.
C) leakages are less than injections which will cause income to increase.
D) leakages are less than injections which will cause income to decrease.
E) leakages are equal to injections which will cause no change in income.
Correct Answer:
Verified
Q35: The figure given below represents the leakages
Q36: Suppose an economy has a government budget
Q37: The spending multiplier measures the change in
Q38: If Saving+Tax+Import > Investment+Government spending+Export, then _
Q39: Suppose an economy operates at a real
Q41: The table given below reports the value
Q42: The table given below reports the value
Q43: Scenario 10.2 A hypothetical open economy has
Q44: Scenario 10.2 A hypothetical open economy has
Q45: The table given below reports the value
Unlock this Answer For Free Now!
View this answer and more for free by performing one of the following actions

Scan the QR code to install the App and get 2 free unlocks

Unlock quizzes for free by uploading documents