The figure given below represents the leakages and injections of an economy. Figure 10.6 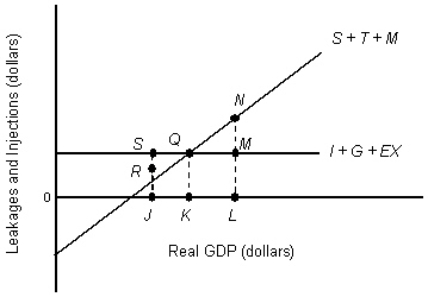 In Figure 10.6, the economy is in equilibrium at point _____.
A) S
B) Q
C) N
D) R
E) M
Correct Answer:
Verified
Q65: The figure given below represents the macroeconomic
Q66: The table given below shows the real
Q67: The table given below shows the real
Q68: The figure given below represents the macroeconomic
Q69: The figure given below represents the macroeconomic
Q71: Assume that a GDP gap can be
Q72: The figure given below represents the leakages
Q73: The figure given below depicts macroeconomic equilibrium
Q74: The figure given below represents the macroeconomic
Q75: The figure given below shows the macroeconomic
Unlock this Answer For Free Now!
View this answer and more for free by performing one of the following actions

Scan the QR code to install the App and get 2 free unlocks

Unlock quizzes for free by uploading documents