The figure given below represents the macroeconomic equilibrium in the aggregate income and aggregate expenditure framework.Assume that MPI is equal to zero. Figure 10.4 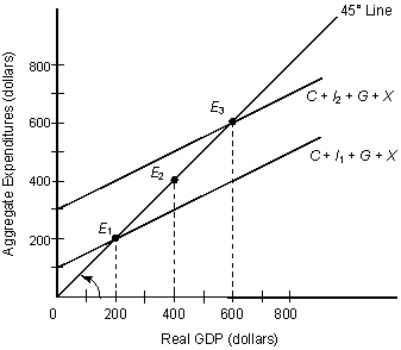 In the figure:
C: Consumption
I1 and I2: Investment
G: Government Spending
X: Exports
Refer to Figure 10.4.The spending multiplier is _____.
A) 2
B) 3
C) 6
D) 0.5
E) 1.2
Correct Answer:
Verified
Q69: The figure given below represents the macroeconomic
Q70: The figure given below represents the leakages
Q71: Assume that a GDP gap can be
Q72: The figure given below represents the leakages
Q73: The figure given below depicts macroeconomic equilibrium
Q75: The figure given below shows the macroeconomic
Q76: The figure given below represents the leakages
Q77: The figure given below depicts macroeconomic equilibrium
Q78: If the spending multiplier equals 5 and
Q79: The table given below shows the real
Unlock this Answer For Free Now!
View this answer and more for free by performing one of the following actions

Scan the QR code to install the App and get 2 free unlocks

Unlock quizzes for free by uploading documents