The figure given below represents the leakages and injections of an economy. Figure 10.6 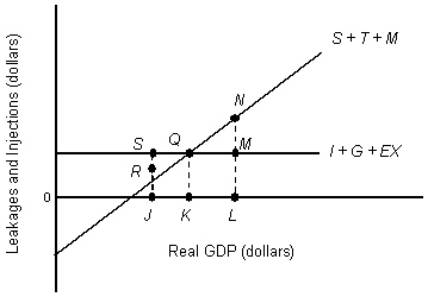 Refer to Figure 10.6.If 0L represents potential GDP, the GDP gap can be closed by increasing autonomous expenditures by an amount equal to line segment _____.
A) NM
B) NL
C) ML
D) OK
E) QK
Correct Answer:
Verified
Q71: Assume that a GDP gap can be
Q72: The figure given below represents the leakages
Q73: The figure given below depicts macroeconomic equilibrium
Q74: The figure given below represents the macroeconomic
Q75: The figure given below shows the macroeconomic
Q77: The figure given below depicts macroeconomic equilibrium
Q78: If the spending multiplier equals 5 and
Q79: The table given below shows the real
Q80: The table given below shows the real
Q81: The Keynesian region of the aggregate supply
Unlock this Answer For Free Now!
View this answer and more for free by performing one of the following actions

Scan the QR code to install the App and get 2 free unlocks

Unlock quizzes for free by uploading documents